This is a brief summary of ML course provided by Andrew Ng and Stanford in Coursera.
You can find the lecture video and additional materials in
https://www.coursera.org/learn/machine-learning/home/welcome
Coursera | Online Courses From Top Universities. Join for Free
1000+ courses from schools like Stanford and Yale - no application required. Build career skills in data science, computer science, business, and more.
www.coursera.org
Linear Regression with one variable
Objective: Understand what the model looks like, the overall process of supervised learning
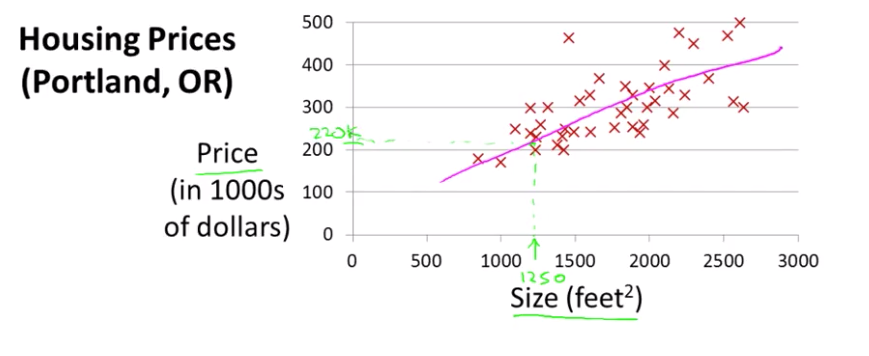
Plot of data set of a number of houses that were different sizes that were sold for a range of different prices.
Assume that you have a friend who wants to sell a house (1250 sq feet) and tell them how much they might be able to sell the house for.
This is an example of supervised learning algorithm.
- Given the "right answer" for each example in the data. Namely what was the actuql house, what was the actual price of each of the houses.
And this is an example of Regression Problem.
- the term regression refers to the fact that we are predicting a real valued output, the price
More formally,
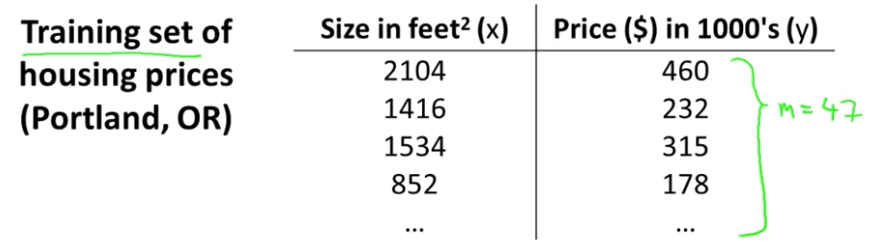
In supervised learning, we have a dataset and this is called a training set.
- So for housing prices example, we have a training set of different housing prices and our job is to learn from this data how to predict prices
Notation:
m = Number of training examples
x's = "input" variable/ features
y's = "output" variable/ "target" variable
(x,y) = a single training example
($x^{(i)}, y^{(i)}$) = index i-th training example
$x^{(1)} = 2014$
$x^{(2)} = 1416$
$y^{(1)} = 460$
Quiz: Consider the training set shown below. ($x^{(i)}, y^{(i)}$) is the i-th training example. What is $y^{(3)}$
1. 1416
2. 1534
3. 315
4. 0
Answer: 3
How the supervised learning algorithm works:
Feed the training set (some data likes housing prices in the above) to the learning algorithm.
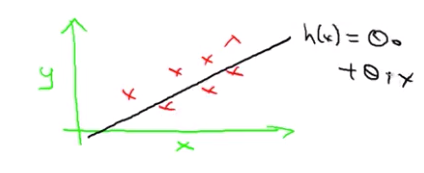
The job of a learning algorithm to then output a function which by convention is usually denoted lowercase h, hypothesis
The job of the hypothesis is takes as input the size of a house (the size of the new house, your friends wanted to sell) and to output the estimated value of y for the corresponding house.
h is a function that maps from x's to y's.

How de we represent h?
$h_{\theta}(x) = \theta_0 + \theta_1 X$
Shorthand: h(x)
Why a linear function?
A more complicated function may fit, but the linear case is the simple building block.
Linear Regression with one variable, with the variable being x. Predicting all the prices as functions of one variable X. And Another name for this model is univariate linear regression.
Lecturer's Note
Model Representation
To establish notation for future use, we'll use $x^{(i)}$ to denote the "input" variables, also called input features, and $y^{(i)}$ to denote the "output" or target variable that we are trying to predict. A pair ( $x^{(i)}, y^{(i)}$ ) is called a training example, and the dataset that we'll be using to learn - a list of m training examples, ( $x^{(i)}, y^{(i)}$ ); i = 1, ... , m - is called a training set. Note that the superscript "(i)" in the notation is simply an index into the training set, and has nothing to do with exponentiation. We will also use X to denote the space of input values, and Y to denote the space of output values. In
To describe the supervised learning problemslightly more formally, our goal is, given a training set, to learn a function h: X -> Y so that h(x) is a "good" predictor for the corresponding value of y. For historical reasons, this function h is called a hypothesis.

When the target variable that we are trying to predict is continuous, such as in the housing example, we call the learning prob a regression problem. When y can take on only a small number of discrete values, we call it a classification problem.


