This is a brief summary of ML course provided by Andrew Ng and Stanford in Coursera.
You can find the lecture video and additional materials in
https://www.coursera.org/learn/machine-learning/home/welcome
Coursera | Online Courses From Top Universities. Join for Free
1000+ courses from schools like Stanford and Yale - no application required. Build career skills in data science, computer science, business, and more.
www.coursera.org
What is overfitting?
Regulaization will ameilorate the overfitting problems.
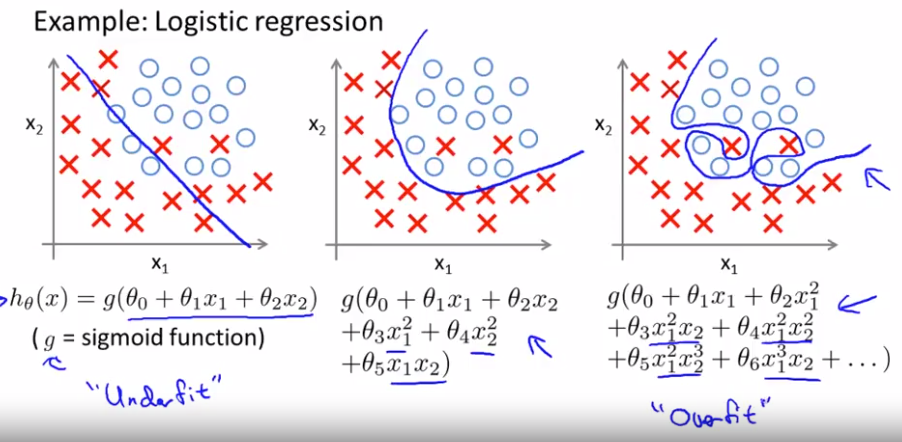
When the algorithm has high bias, it is just not even fitting the training data very well. If fitting a straight line to the data, then it is as if the algorithm has a strong preconception, or a strong bias, and despite the data to the contrary, preconception still are bias, still closes it to fit a straight line and this ends up being a poor fit to the data.
When overfitting, we can actually fill a curve that process through all training examples, seems to do a very good job fitting the training set and that is processed through all of the data at least, but makes some wiggly curves all over the place and that is not such a good prediction model.
If overfitting, or high biased, if we are fitting such a high order polynomial, then, the hypothesis can fit almost any function, this face of possible hypothesis is just too large or it is too variable.
To recap,
the probelm of overfitting comes when if we have too many features, then to learn hypothesis may fit the training side very well. So your cost function may actually be very close to zero or may be even zero exactly, but you may then end up with a tries too hard to fit the training set, so that it even fails to generalize to new examples and fails to predict prices on new examples.
The term generalize refers to how well a hypothesis applies even to new examples. (even for the data that has not seen in the training set)

Quiz: Consider the medical diagnosis problem of classifying tumors as malignant or benign. If a hypothesis hθ(x) has overfit the training set, it means that:
a. It makes accurate predictions for examples in the training set and generalizes well to make accurate predictions on new, previously unseen examples.
b. It does not make accurate predictions for examples in the training set, but it does generalize well to make accurate predictions on new, previously unseen examples.
c. It makes accurate predictions for examples in the training set, but it does not generalize well to make accurate predictions on new, previously unseen examples.
d. It does not make accurate predictions for examples in the training set and does not generalize well to make accurate predictions on new, previously unseen examples.
Plotting the hypothesis can be a way to decide what degree polynomial to use. but that does not always work.
We may have learning problems that where we just have alot of features.
When we have so many features, it also becomes much harder to plot the data, and it becomes much harder to visualize it to decide what features to keep or not.
If we have a lot of features, but not so many training data, then overfitting can be a problem.

Addressing overfitting:
Options:
1. Reduce number of features.
- manually select which features to keep.
- model selection algorithm.
But by throwing away some of the features, is also throwing away some of the information you have about the problem. For example, maybe all of those features are actually useful for predicting the price of a house. so maybe we don't actually want to throw some of our information or throw some of our features away.
2. Regularization:
- keep all the fatures, but reduce magnitude/values of parameters.
- works well when we have a lot of features, each of which contributes a bit to predicting y.
Lecturer's Note
The Problem of Overfitting
Consider the problem of predicting y from x ∈ R. The leftmost figure below shows the result of fitting a y = θ0+θ1x to a dataset. We see that the data doesn’t really lie on straight line, and so the fit is not very good.

Instead, if we had added an extra feature $x^2$ , and fit $y = \theta_0 + \theta_1 + \theta_2 x^2$ , then we obtain a slightly better fit to the data (See middle figure). Naively, it might seem that the more features we add, the better. However, there is also a danger in adding too many features: The rightmost figure is the result of fitting a $5^{th}$ order polynomial $y = \sum_{j=0}^5 \theta_j x^j $. We see that even though the fitted curve passes through the data perfectly, we would not expect this to be a very good predictor of, say, housing prices (y) for different living areas (x). Without formally defining what these terms mean, we’ll say the figure on the left shows an instance of underfitting—in which the data clearly shows structure not captured by the model—and the figure on the right is an example of overfitting.
Underfitting, or high bias, is when the form of our hypothesis function h maps poorly to the trend of the data. It is usually caused by a function that is too simple or uses too few features. At the other extreme, overfitting, or high variance, is caused by a hypothesis function that fits the available data but does not generalize well to predict new data. It is usually caused by a complicated function that creates a lot of unnecessary curves and angles unrelated to the data.
This terminology is applied to both linear and logistic regression. There are two main options to address the issue of overfitting:
1) Reduce the number of features:
- Manually select which features to keep.
- Use a model selection algorithm (studied later in the course).
2) Regularization
- Keep all the features, but reduce the magnitude of parameters θj.
- Regularization works well when we have a lot of slightly useful features.


